
The covid-19 pandemic has delivered a brutal shock to an oil and gas industry that was already ailing before the outbreak. Just as importantly, it has also exposed the shortcomings of traditional energy data gathering and market analysis – at a time when data accuracy and integrity are more critical than ever. In this context, new data sources based on satellite imaging and other technologies provide sorely needed transparency that is not commonly available from any other source.
Like the airline, hotel and food service industries, the oil and gas sector has been disproportionately hurt by the pandemic. Oil consumption and economic activity are closely linked, so the slowdown in trade, industry and services due to the pandemic could be expected to ripple through the oil sector and send prices in a tailspin. Given the outsize share of transportation and personal mobility in oil demand, global confinement measures could in fact be expected to impact oil demand even more severely than the broader economic slowdown alone would suggest.
Initial assessments of the oil demand impact of covid-19 by mainstream forecasters were surprisingly subdued. In its March Oil Market Report, the International Energy Agency projected that global oil demand would contract by 2.5 million barrels per day (MMB/d) annually in the first quarter but quickly rebalance, with zero growth in the second quarter followed by a modest recovery in the second half of the year. For the year as whole, demand would show the first contraction since 2009, but the average loss was expected to remain shallow – less than 1 MMB/d, or below 1%. By mid-April, as the severity of the outbreak became clear, the IEA revised its outlook and projected a massive demand loss culminating at 29 MMB/d (30%) in April, and 9,3 MMB/d for the year as a whole.
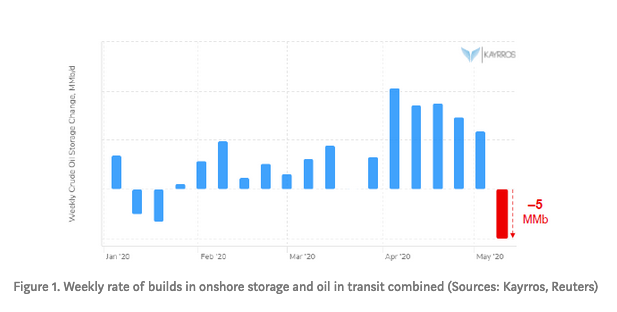
That reassessment made sense on paper. Trouble was that satellite measurements of what was actually happening on the ground never backed it up. Crude oil inventory changes, a good, direct indication of changes in supply and demand balances, showed the market’s oversupply, while staggering by historical standards, never came close to the catastrophic losses projected by the IEA. Even as the IEA and most analysts in both the public and private sectors projected losses of around 30% in April, Kayrros measurements showed crude stock builds averaged less than 10 MMB/d that month, including both changes in onshore storage and in oil on the water – much less if just onshore stocks were factored in. Taking into account smaller builds in product inventories and likely changes in secondary and tertiary oil stocks, this implied demand loss of 15% at the most. In addition, realtime measurements showed the builds quickly reversed, leading to relatively steep draws in May.
Kayrros’ direct observations of on-road traffic and industrial activity around the world, leveraging satellite and geolocation data, further supported this assessment.
Oil demand is famously tricky to assess — let alone predict – by traditional means, split as it is among billions of consumers and many refined products, from gasoline to lubricants to petrochemical feedstocks. Demand forecasts are routinely off. So are estimates of current and even past consumption, which remain subject to major revisions long after the fact. Most current assessments are little more than (highly) educated guesses based on economic indicators such as the number of countries under containment, the type of containment measures, airline projections and reports of lower car sales that hint at reduced demand for oil-based plastics. These estimates, as the IEA itself emphatically cautioned in its April report, are inherently “fraught with uncertainties.”
[blog_cta]
In contrast, new data technologies provide unbiased insights into market developments in near realtime. These measurements challenge and often dispel the assumptions that underpin traditional forecasting methodologies.
With the benefit of these new measurements, it become easier to understand where mainstream projections of the demand impact of covid-19 went wrong. For example, doomsday assessments assumed lockdown measures were global. While the coronavirus pandemic has certainly been worldwide in reach and scale, its impacts have not been simultaneous, however. When China first went into lockdown, the downward price response actually stimulated crude oil demand elsewhere, a partially mitigating effect. By the time the rest of the world followed China into confinement, China itself started deconfining and its demand rebounded with a vengeance.
Similarly, initial assessment of demand losses understandably zoomed in on the effect of confinement measures on passenger travel, the single largest source of oil consumption. But there are many other uses of oil, and here too the drop in personal mobility came with partially offsetting factors. Diesel demand proved remarkably resilient as online shopping supported freight transport and home deliveries. Jet fuel demand plunged as passenger flights were cancelled, but that was partially offset by the greater resilience of cargo air traffic. Cruise ships ground to a halt, but the volumes of oil on the water went through the roof, causing tankers to use more fuel. Car factories require less plastics as orders dried up and workers stayed home, but demand for disposable plastics increased as a way to deal with contagion risks.
As reported data start creeping in, initial IEA and other assessments of demand losses are now slowly being steadily revised. These badly lagged data are coming much closer to Kayrros’ iinitial estimates. In its May report, the IEA thus cut back its assessment of April demand losses by nearly 4 MMB/d, and by another 3.4 MMB/d in June report – even while noting that projected demand losses still exceed observed losses and hinting at further revisions down the road.
Traditional demand assessments work best when the market is steady and historical patterns are a good predictor of future performance. With the coronavirus, the market has entered uncharted waters. The assumptions that underpin traditional assessments as likely to be misleading as helpful. There really is no precedent for Covid-19, so there is no way to model its impact. Actual measurements, a huge improvement on our understanding of the market under any circumstances, are even more essential in these unusual times.