


- European carbon emissions have never been falling faster — at least not since Kayrros Carbon Watch stated tracking them in 2016.
- The power sector is leading the plunge, with electricity related emissions down to multi-year lows, thanks to a combination of shrinking winter heating demand and surging solar power generation capacity.
- Power-sector emissions, historically the main driver of EU carbon emissions, dipped below the level of industrial emissions repeatedly this year, and again came close to industrial levels in early November. There is no previous record of power emissions having ever fallen below industrial emissions.
- Unlike in 2020, when EU carbon emissions bounced back after the lifting of COVID lockdowns, this year’s drop will likely be longer-lasting. Whereas the 2020 decline was largely circumstantial and economically driven, this year’s dip is more structural. The “greening” of the European power fuel mix has accelerated since the invasion of Ukraine, reducing the need for fossil fuels – and associated emissions – in electricity generation.
- On the fip side, a cleaner electricity market puts downward pressure on carbon prices, potentially undermining efforts to reduce emissions from other sectors.
EU carbon emissions are plummeting
Source: Kayrros Carbon Watch
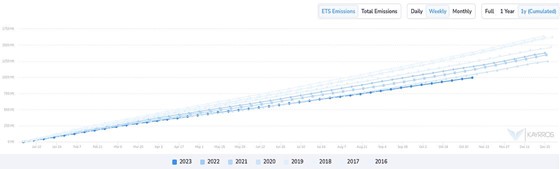
- EU ETS emissions (carbon emissions from EU regulated sectors) fell to their lowest level year-to-date since at least 2016, totalling only 994 MT by early November, Kayrros Carbon Watch shows. This was the frst time in at least eight years that cumulative EU emissions failed to rise above 1,000 MT for this time of year.
- Cumulative EU ETS carbon emissions have plunged by 15% year-to-date from the same period last year – an even steeper contraction than in 2020, when COVID lockdowns slashed emissions by 14.2%.
- The declining trend in EU emissions actually predates the pandemic. Emissions fell nearly 10% in 2019, and only partially bounced back from COVID lows in 2021. The recovery slowed in 2022, before swinging back into contraction this year.
- Unlike the 2020 drop, which was economically driven, this year’s plunge is more structural and will therefore be “stickier.”
The power sector leads the plunge
Source: Kayrros Carbon Watch
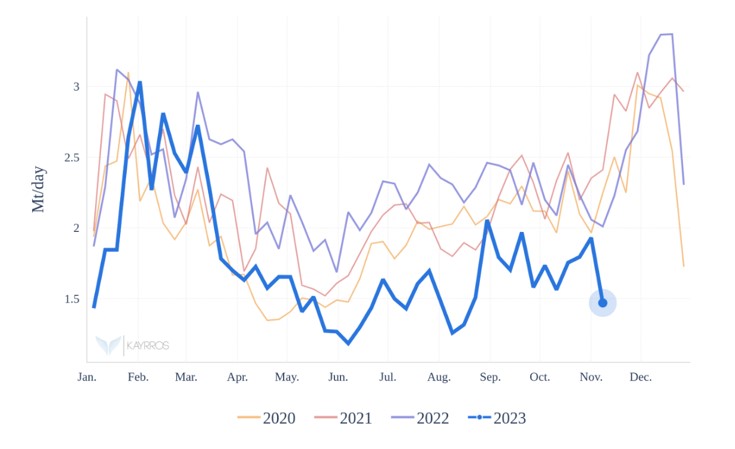
- EU cumulative carbon emissions from power generation hit their lowest level in early June since at least January 2016, Kayrros Carbon Watch shows.
- In early June 2023, weekly CO2 emissions from the region’s electricity sector fell to an estimated 1.18 mt/day, their lowest weekly average since the start of Carbon Watch data in 2016.
- Cumulative EU power emissions since January are down more than 23% from the same period last year, accounting for more than 90% of the overall decline in EU ETS emissions.
- The plunge primarily refects steeply lower coal burning at EU power plants. EU emissions from coal-fred power generation plummeted by more than 27% from the same period last year.
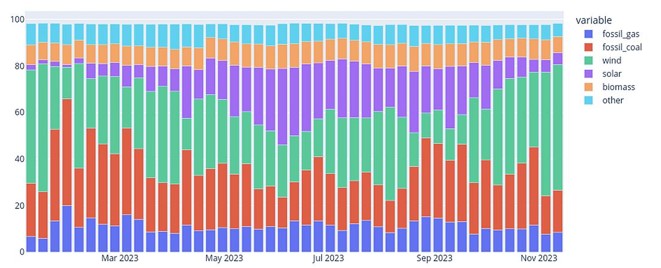
Rising sun
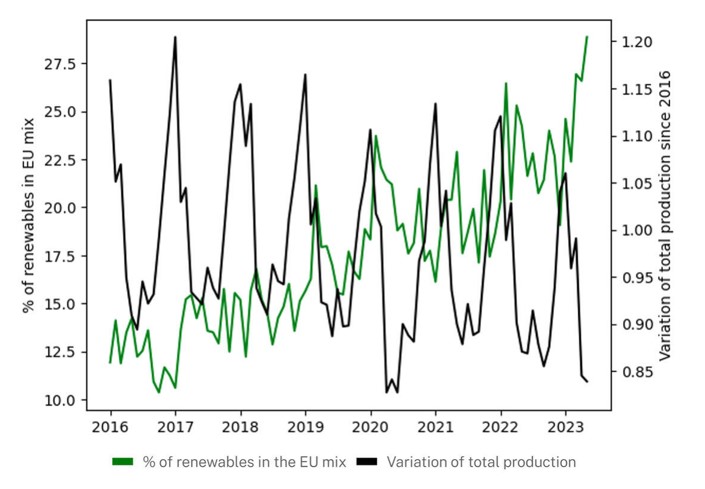
- Declining coal burn in Europe in turn stems from both supply and demand factors: changing weather patterns and a greener power mix.
- On the demand side, mild winter temperatures in 2022-23 and this year have slashed heating demand – potentially a lasting feature given the way climate change is going.
- In early June, the EU produced less electricity than at any time since April 2020, the peak of the COVID lockdowns.
- On the supply side, the Russian invasion of Ukraine has lit a fuse under solar capacity, permanently displacing fossil fuels.
- Germany, Europe’s top coal consumer, has cut its coal burn since January, with consumption down to its lowest level on record in early June. Poland, the Czech Republic and Bulgaria — the EU’s next largest consumers – have followed suit.
- The combination of plunging electricity demand and surging renewable capacity has dramatically lifted the share of renewables in the EU power mix.
When the wind blows, EU emissions fall
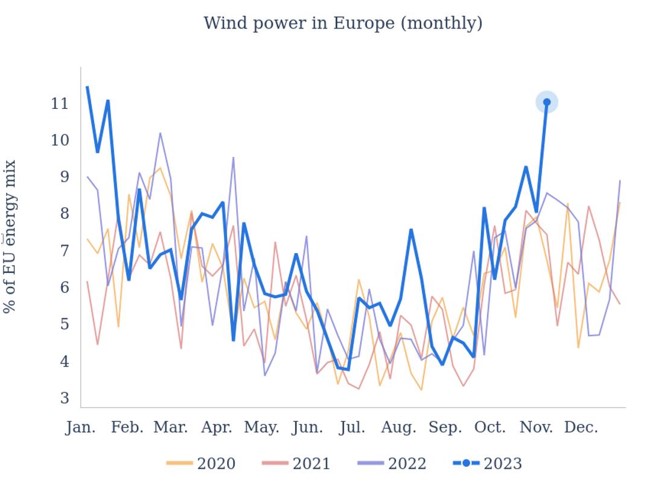
Although solar capacity has been leading the growth in EU renewable electricity generation, wind power is a big factor too.
In early November, stormy weather sent wind power generation in Germany fying, with the wind share of power generation crossing above the 50% mark for the second time this year.
Thanks in part to this surge, EU ETS-regulated emissions plunged by 17.5% week-on-week overall in early November, led by a 30.6% drop in power generation.
Trading places
Source: Kayrros Carbon Watch
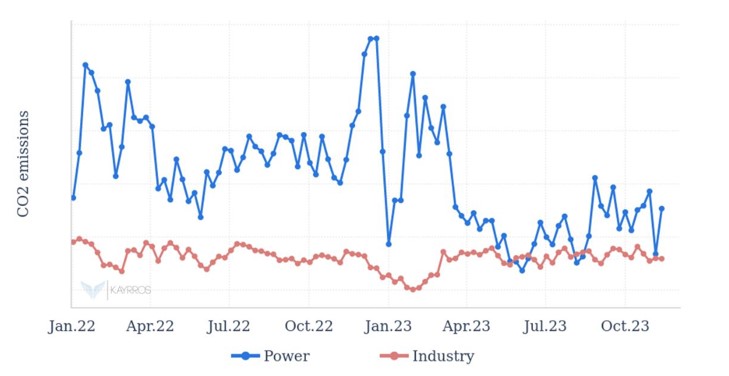
Even as emissions from the EU power sector have plunged, those from the region’s industrial sector have recovered somewhat from recent lows.
In early June, EU electricity-sector emissions fell below industry-related emissions for the frst time since the start of Kayrros data in January 2016.
Industrial emissions again exceeded power emissions in early August, and came close to their level in early November.