
Throughout the past year, Covid-19-induced lockdown measures swept across the globe, disrupting almost everything from individual daily lives to the world’s biggest economies. One of the most striking changes has been the mass move away from office spaces and into the home that not only impacting the workday itself, but also the commute from one to the other.
To generate a big picture view on the nature and scale of this disruption, Kayrros combined multiple datasets to capture and analyze key insights from the changes in everyday commuting habits and traffic patterns.
On-Road data show commuter traffic nearing recovery
At the core of Kayrros On-Road Gasoline and Diesel Consumption analyses is a massive mobile geolocation dataset, which, combined with big-data processing algorithms, provides a granular view of human mobility and associated fuel consumption during the pandemic. This shows a sharp decline of about 40% in the total commute mileage in March 2020 following the initial lockdown measures. Mileage levels have since nearly fully recovered, suggesting that most but not all Americans have resumed their normal day-to-day driving activity.
Trip segmentation and commuter classification
Kayrros uses geolocation data, which are captured by mobile devices, to extract insights that include commuting time, locations visited, and duration stayed. The combination of these insights delivers an unparalleled view into the American daily mobility routine.
The histogram below illustrates the bimodal distribution of the daily commute mileage with two modes centered around 8 a.m. and 5 p.m., with the commute-trip mileage being derived by analyzing device movements.
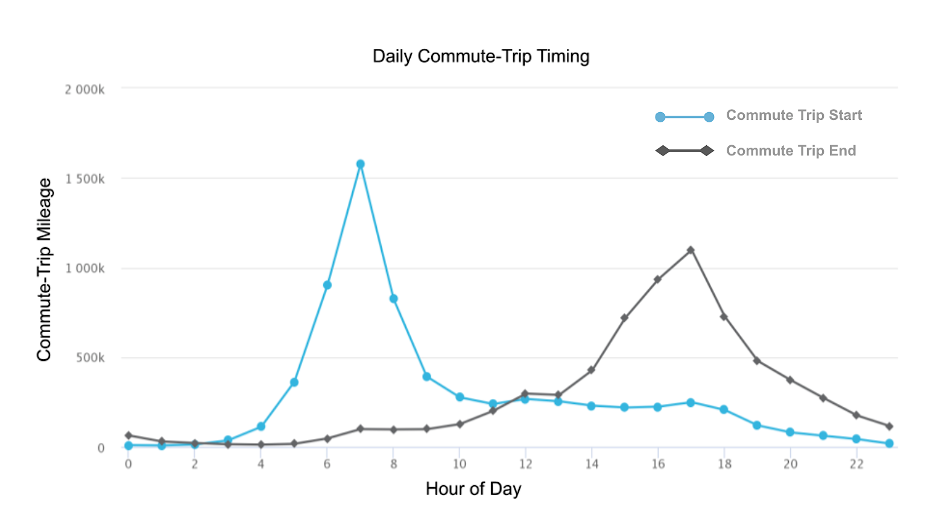
A commute-trip is defined as any trip that intersects the “Home” and “Work” locations for an individual mobile device. The two locations are classified as “Home” and “Work” based on the time of day and time duration for which the mobile device is present at each location. Trip segments that do not intersect with the “Home” and “Work” locations for that device are identified as “Recreational Driving”. All other routine trips that do not intersect with the “Work” location are classified as “Other Commute”.
Pandemic disrupts the daily commute
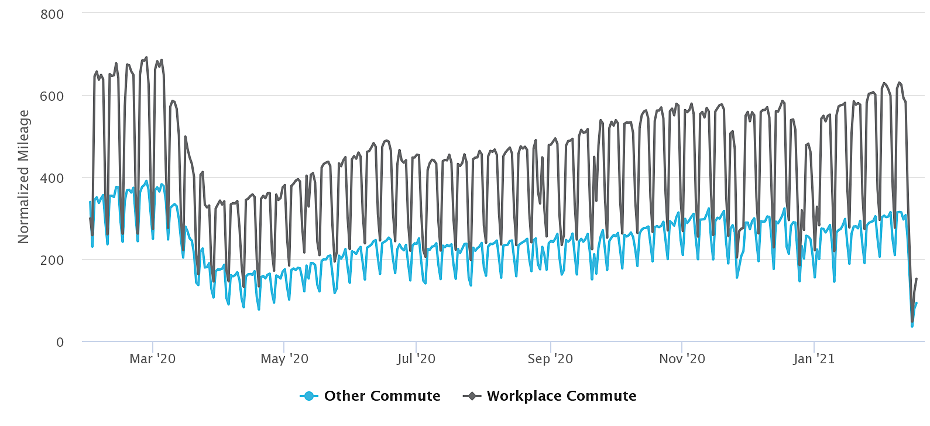
With trip segments classified by type, Kayrros tracks variations in the proportions of different classes of trips through time, beginning in January 2019. The time period from then until March 2020 can be considered the “normal” pre-pandemic routine. Contrasting this with the data observed after March 2020 leads to a number of observations.
The initial impact of the COVID-19 pandemic, for example, is reflected in a significant reduction in mileage across all trip classes. Then, for the two-month period following the nationwide implementation of lockdown and isolation measures, it effectively eliminated long-distance or overnight driving trips. Workplace commute mileage recorded a ~40% drop from March to April 2020, as many organizations adopted work-from-home policies and most schools switched to remote learning.
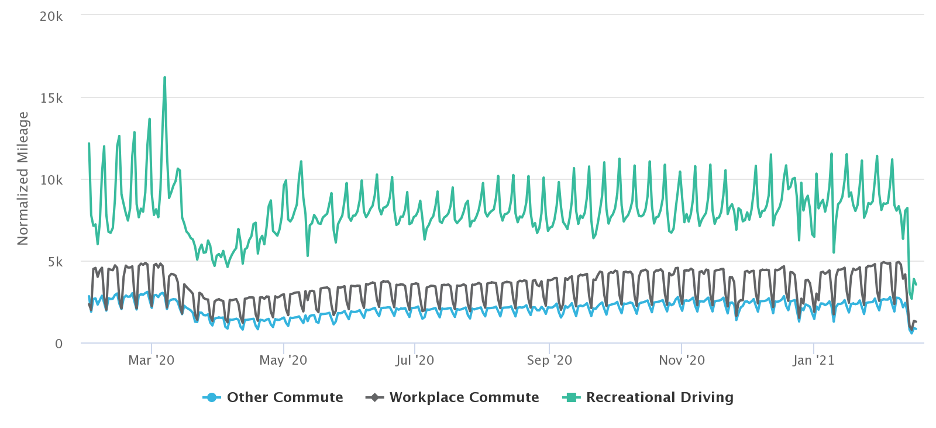
Average US Behavior-Classified Mileage per Device
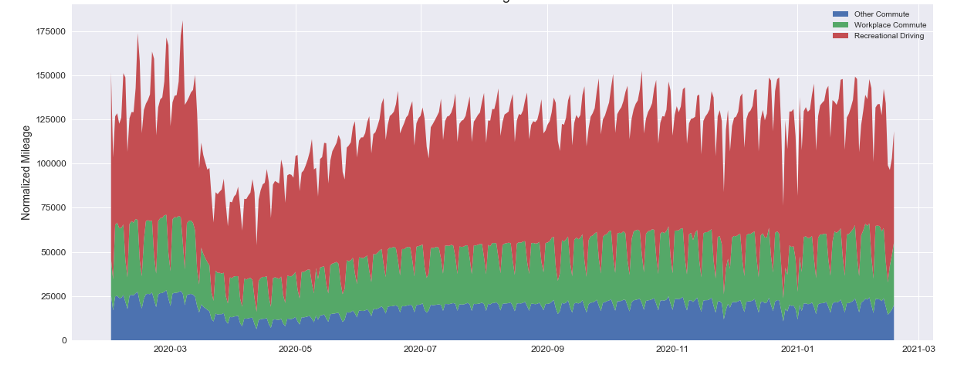
A strong recovery took hold beginning in late April through July 2020, particularly in the recreational driving segment. In this period, the workplace commute mileage recovered ~30% from its March low. Further, the commute trip mileage has continued to recover, albeit at a lower rate, returning to levels close to those of before the pandemic by February 2021.
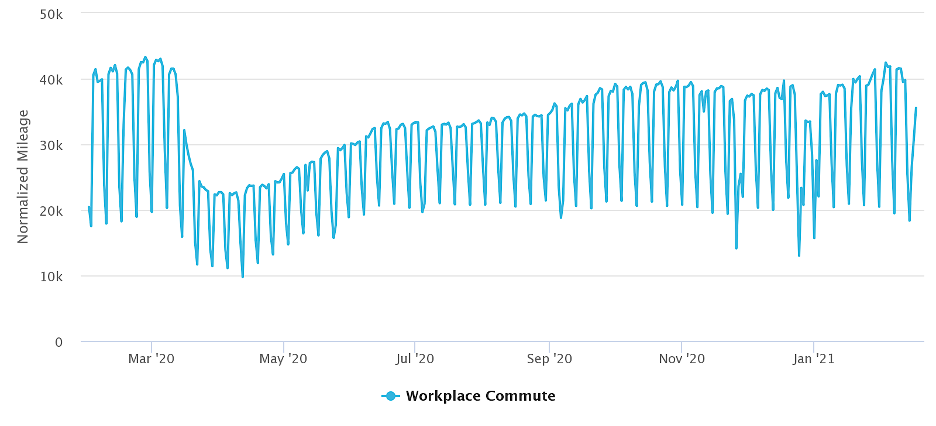
Average US Workplace Commute Mileage per Device
Individual states added additional variations. In Texas, traffic followed a similar recovery pattern as the US in general, but the recovery in the second week of February was temporarily disrupted by the record-low temperatures and icy road conditions in the typically warm southern climate.
Average Texas Behavior-Classified Mileage per Device
Harris County, being the largest county in Texas by population, accounts for a major portion of the state’s total commute mileage. The geolocation data for Harris County, which spans the city of Houston, suggested, however, that Houstonians were resuming their workplace routines more gradually. Harris county is one of the US counties that was hit the hardest by the pandemic, with new daily cases peaking in mid-January 2021.
Average Behavior-Classified Mileage per Device in Harris County
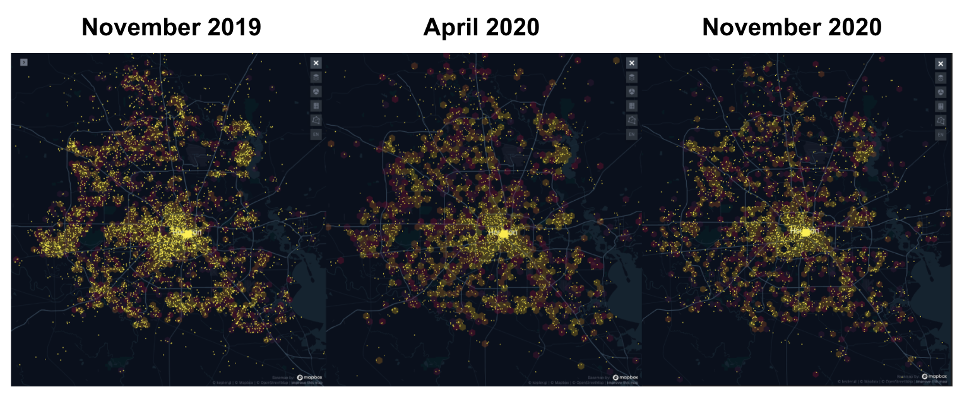
While most Texas schools reopened at some capacity beginning in September 2020, a large portion of the non-essential workforce has remained in the work-from-home capacity. This is illustrated in the below map, which captures commute-trip segments to and from Houston’s downtown district—home to many public and corporate offices–at three points in time. The downtown commute density in November 2020 is much lighter compared to that of pre-Covid in November 2019.
Short-term response or long-term change?
Kayrros deploys proprietary algorithms on geolocation data at scale to identify and characterize different classes of human mobility to track activity patterns through time on a daily basis. By doing so, we have been able to discern unique insights and deliver daily intelligence on patterns of human mobility and associated fuel consumption. Focusing this effort on understanding the consequential impacts of the COVID-19 pandemic, we have found that while most Americans have since resumed their pre-pandemic commute patterns, some are continuing to work from home. The question remains: is the remote working flexibility here to stay, or will we eventually see a full recovery of commuting trips and workers returning to their offices full-time?
About Kayrros On-Road Gasoline and Diesel Consumption Index
The On-Road Gasoline and Diesel Consumption Index provides a bottom-up view of the daily fuel demand for on-road transportation, which accounts for a major portion of the energy demand from the transportation sector, and a large portion of the total energy demand. As part of our broader solutions portfolio, the On-Road analysis aims to inform better trading decisions using near-realtime data covering the US and European end-use markets. The most recent data suggest a definitive trend to full recovery in gasoline spending in the US, which, subject to the available gasoline supply, can signal rising gasoline prices.
By Lane Boyer, Yelena Kiyanitsa and Eric Qian