
Kayrros examines road traffic signals in the US and reveals that the decline in US demand has slowed and may be on a path to recovery
The global demand collapse and more permanent demand destruction looms large in the oil balance. Rising inventory levels continue to place downward pressure on oil prices and the wider global economy, but a U-shaped demand recovery could reverse inventory builds in 2020 and throw prices and oil producers a lifeline in the medium term.
Kayrros examines road traffic signals in the US and reveals that the decline in US demand has slowed and may be on a path to recovery. This observed uptick in end user demand may be a precursor to reversing reduced refinery runs over the last month. Taking China’s recovery as an example, US refinery runs may rebound in the weeks ahead.
US Refinery runs follow China’s trend
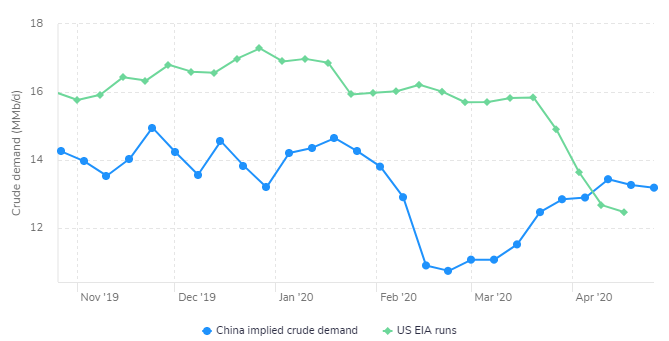
Kayrros, using storage measurements and shipping data, estimates that crude runs in China have recovered to pre-lockdown levels after taking a four-week nosedive in February. During March and April, refinery runs in China picked up more than 3 MMb/d.
The US EIA has reported a decline in US refinery runs similar to that seen in China with a one-month delay. In both cases, crude inventories soared as refinery runs plummeted. As US on-road demand begins to show signs of recovery, the US oil market may be poised to reverse course and continue to track what we saw in China a month ago. Taking China as the prototype for demand and applying a four-week lag, fuel demand in the US and other economies will experience a recovery in May.
Road traffic in the US shows signs of recovery
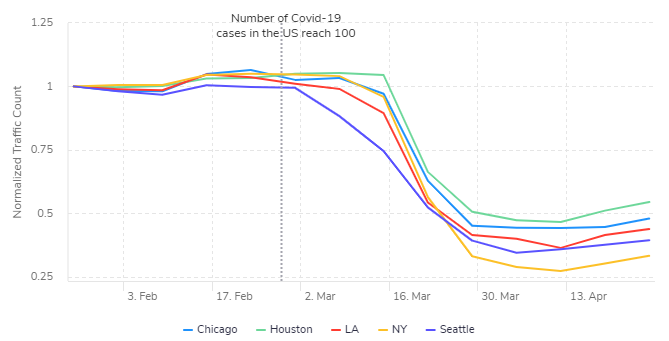
Traffic in five major cities — Chicago, Houston, Los Angeles, New York City and Seattle — has already begun to recover in April. On-road fuel consumption took a sharp decline in March as much of the US went into government-mandated lockdowns. Traffic reached its lowest point in the week of April 6, leveling off for a couple of weeks before showing signs of revival in mid-April.
US commercial vehicle traffic remains resilient even as greater economy slows to a halt
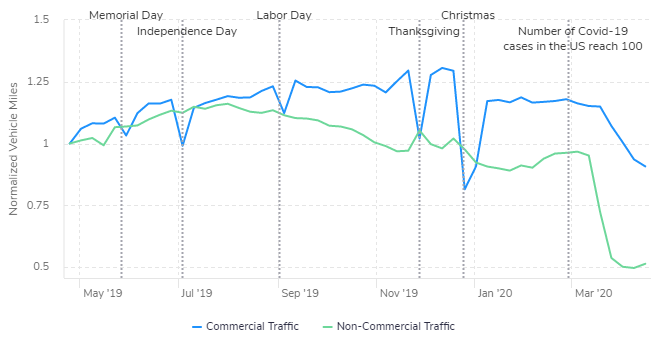
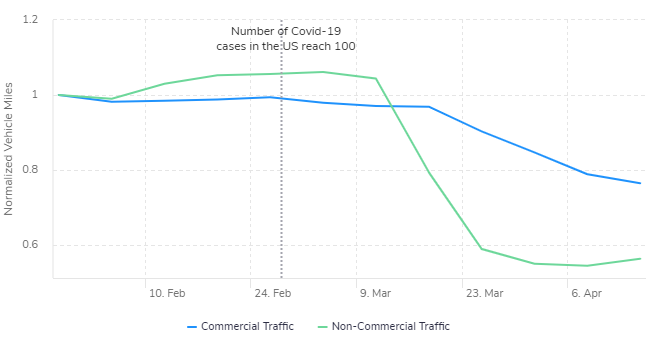
The drastic effect of lockdowns is seen almost exclusively in non-commercial vehicles and impacts gasoline demand immediately. Heavier fuels consumed by commercial traffic are impacted less. The decline in US commercial vehicle traffic has been more gradual and, while the drop is significant, on-road demand remains above levels seen during the week following Christmas.
Traffic from commercial vehicles often declines during holidays, moving opposite of non-commercial vehicles. Kayrros isolates commercial traffic from non-commercial traffic by filtering for vehicles traveling an excess of 2,000 miles per week.
While US commercial vehicle traffic has been more resilient, the recovery Kayrros observes is attributed entirely to a rebound in non-commercial traffic. Commercial traffic continues to slowly decline.